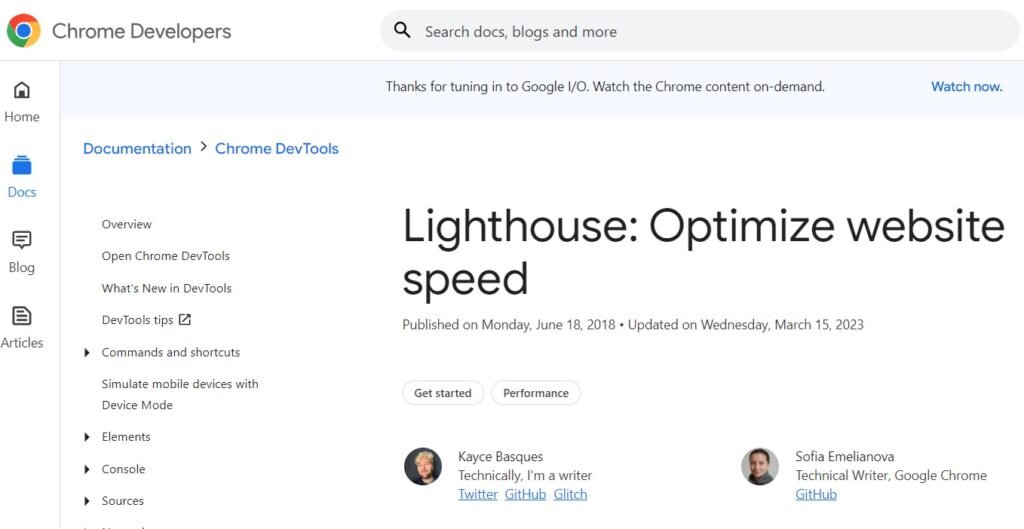
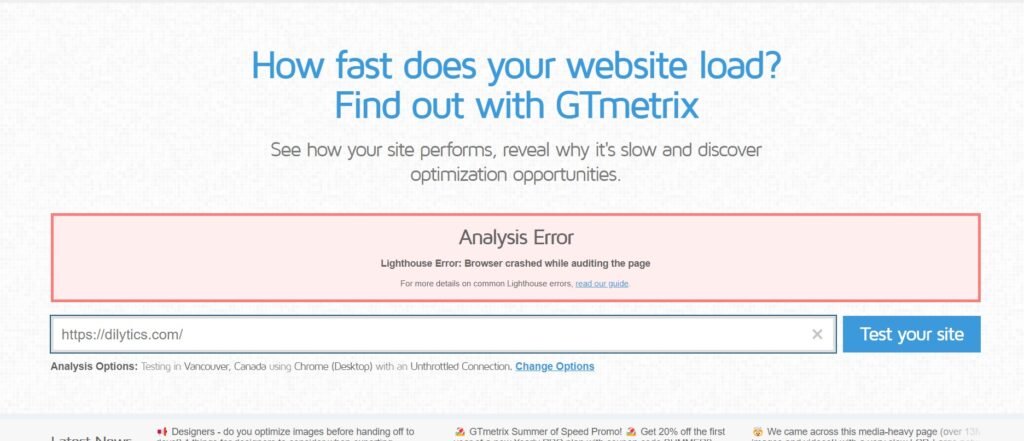
Imagine you’re in the middle of a thrilling online adventure, browsing a website for important information, and suddenly, your browser crashes! Frustrating, isn’t it? Well, this annoyance isn’t just a random occurrence; it’s a common issue many websites face, and it’s known as the “Lighthouse Error: Browser crashed while auditing the page.“
Table of Contents
In this exploration, we’ll demystify this perplexing error, uncovering why it happens, how it affects your online experience, and most importantly, how to fix it. So, buckle up as we embark on a journey to understand and conquer the challenge of browser crashes during webpage audits.
Why does this error happen?
When Lighthouse audits a page, it needs to parse, evaluate, and execute all of the CSS and JavaScript files on the page. This can be a lot of work for the browser, especially if the files are large and complex. If the browser runs out of memory while doing this, it will crash.
Causes of Browser Crashes
As detailed in the Lighthouse Errors article, when a browser crashes during a Lighthouse audit, it often results from the following factors:
- Large CSS Files: Webpages with overly large CSS files can strain a browser’s resources, causing it to crash. CSS files define the visual style and layout of a webpage.
- Complex JavaScript Code: Excessive or complex JavaScript code can also overwhelm a browser. JavaScript is responsible for interactivity and dynamic features on a webpage.
How to solve this error
There are a few things you can do to solve this error:
- Reduce the size of your CSS and JavaScript files. You can do this by compressing your files, minifying your code, and combining multiple files into one.
- Use a content delivery network (CDN). A CDN can serve your CSS and JavaScript files from servers that are closer to your users, which can reduce the amount of data that needs to be downloaded and can also improve performance.
- Use a performance optimization plugin. There are a number of plugins available that can help you to reduce the size and complexity of your CSS and JavaScript files.
Also Read: TooManyRequests: The request was denied due to request throttling | How to Fix
Step-by-step guide to solving the error

- Identify the large or complex CSS and JavaScript files on your page. You can do this by using a tool like the Chrome DevTools Lighthouse report.
- Reduce the size and complexity of these files. You can use a tool like CSSMin or JSMin to compress your files, and a tool like UglifyJS to minify your code.
- Combine multiple CSS and JavaScript files into one. This will reduce the number of files that the browser needs to download and parse.
- Use a CDN to serve your CSS and JavaScript files. This will improve performance and reduce the load on your server.
- Use a performance optimization plugin. There are a number of plugins available that can help you to reduce the size and complexity of your CSS and JavaScript files.
Drawbacks of this Issue
Addressing the “Lighthouse Error” is crucial because it comes with several drawbacks:
- Decreased User Experience: When a webpage crashes, it disrupts the user’s experience, causing frustration and discouraging them from returning to the site.
- Lower Website Traffic: Crashes deter visitors, leading to a drop in website traffic. This can negatively impact your site’s search engine ranking and visibility.
- Potential Loss of Revenue: For e-commerce websites and online businesses, a crashing webpage can result in lost sales opportunities, directly impacting revenue.
To reduce the size and complexity of these files, you can use tools like CSSMin and JSMin to compress them, and UglifyJS to minify them. You can also combine multiple CSS and JavaScript files into one.
Once you have reduced the size and complexity of your CSS and JavaScript files, you can use a CDN to serve them. This will improve performance and reduce the load on your server.
Finally, you can use a performance optimization plugin to help you to further reduce the size and complexity of your CSS and JavaScript files.
By following these steps, you can solve the Lighthouse error “Browser crashed while auditing the page” and improve the performance of your website.
FAQs
What is a Lighthouse error?
A Lighthouse error refers to a problem encountered during the website auditing process using Google’s Lighthouse tool. This tool assesses various aspects of a webpage, including performance, accessibility, and SEO, to provide insights into its quality. Lighthouse errors indicate issues or obstacles that prevent the tool from completing its evaluation successfully. These errors can range from performance-related problems, such as slow page loading, to issues with web accessibility or security. Addressing Lighthouse errors is crucial for optimizing websites and ensuring a seamless user experience.
How can I activate Lighthouse in Chrome?
Activating Lighthouse in Chrome is a straightforward process. First, open Google Chrome and navigate to the webpage you want to audit. Then, access the Developer Tools by pressing F12 or right-clicking on the page and selecting “Inspect.” In the Developer Tools panel, click on the “Lighthouse” tab. You can choose from various audit categories like Performance, Accessibility, Best Practices, and SEO. After selecting your preferred options, click the “Generate report” button, and Chrome will run the Lighthouse audit and provide you with insights and suggestions to improve your webpage.
What is the error encountered in GTmetrix Lighthouse?
GTmetrix utilizes Google’s Lighthouse tool to assess website performance. The errors you might encounter in GTmetrix Lighthouse are similar to those in the standalone Lighthouse tool. They can include issues with page loading speed, inefficient coding, unoptimized images, or problems with web accessibility and SEO. These errors serve as indicators of areas that require attention and improvement on your website to enhance its overall performance, user experience, and search engine ranking.
What is Lighthouse within Google Chrome?
Lighthouse in Google Chrome is a built-in auditing tool that helps web developers and site owners evaluate the performance and quality of their websites. It assesses various aspects, including page speed, accessibility, best practices, and SEO. To access Lighthouse in Chrome, open the Developer Tools by pressing F12 or right-clicking on a page and selecting “Inspect.” Then, click on the “Lighthouse” tab to initiate an audit. Chrome’s Lighthouse provides valuable insights and recommendations to optimize websites for better user experiences and higher search engine rankings.
How can I enhance Google Lighthouse performance?
Improving Google Lighthouse performance involves addressing the issues identified during the audit. Common areas for improvement include optimizing images, minifying and compressing code, reducing server response times, and ensuring proper resource caching. Implementing these recommendations can enhance page loading speed and overall website performance. Additionally, focus on improving web accessibility, adhering to best practices, and optimizing SEO elements to create a well-rounded, high-quality website.
What are the alternatives to Lighthouse in Chrome?
While Lighthouse is a powerful tool for website auditing, there are alternatives available for specific purposes. Some popular alternatives include WebPageTest, GTmetrix, and PageSpeed Insights. WebPageTest provides detailed performance testing, GTmetrix offers a comprehensive report on page performance, and PageSpeed Insights evaluates page speed and offers optimization suggestions. Choosing the right tool depends on your specific needs and preferences, but Lighthouse remains a robust choice for in-depth website assessments within Google Chrome’s Developer Tools.
Wrapping up
In conclusion, the “Lighthouse Error: Browser crashed while auditing the page” is triggered by the excessive size and complexity of CSS and JavaScript files on a webpage. To fix this issue, identify problematic files, minify, compress, and remove unnecessary code. Failing to address this problem can lead to decreased user experience, lower website traffic, and potential revenue loss. It is essential to tackle this issue promptly to improve website performance and enhance user satisfaction.

